Using the ARR Analysis Excel Add-in
This page explains how to use the ARR Analysis Excel Add-in to analyze annual recurring revenue (ARR) and related SaaS metrics.
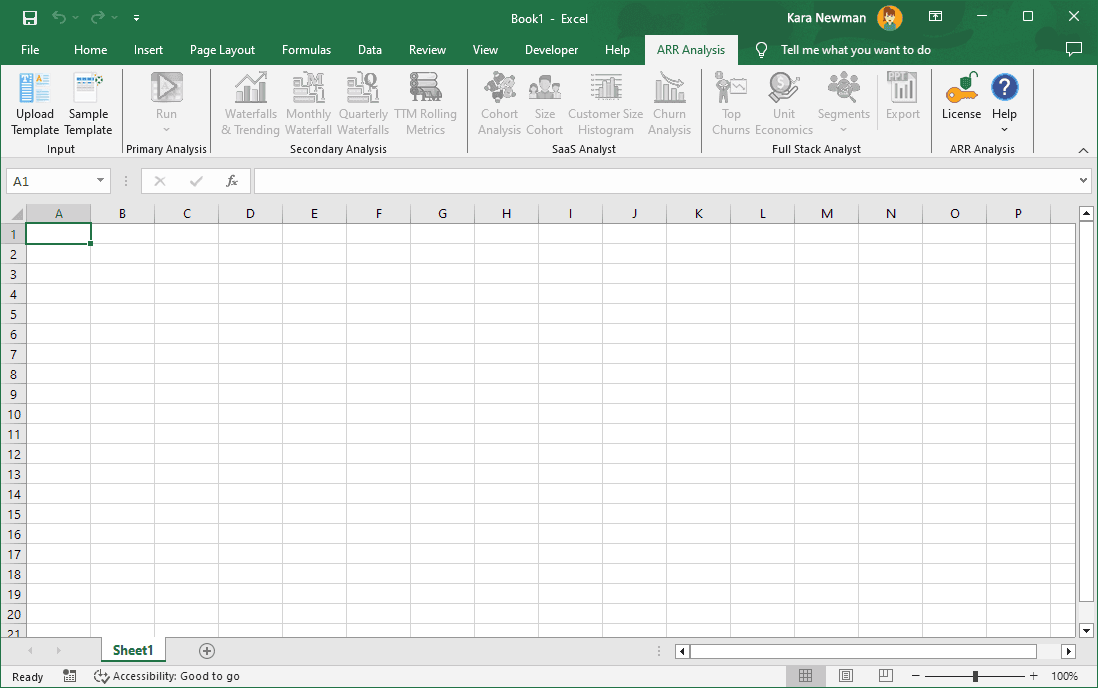
The add-in appears in Excel as a ribbon with six groups of features. Each group contains buttons that generate reports, visualizations, and analyses from your ARR data.
You can also refer to the usage video availble here:
1. Open Excel and Access the Add-in
- Launch Excel and open a workbook.
- Ensure the ARR Analysis Add-in is installed — it appears as a dedicated ribbon tab at the top of Excel.
2. Input
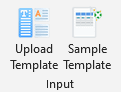
- Upload Template – Upload a prepared Excel template file with ARR data (by customer and month).
- Sample Template – Generate a sample template pre-filled with fake data, which helps you understand the required format for your real data.
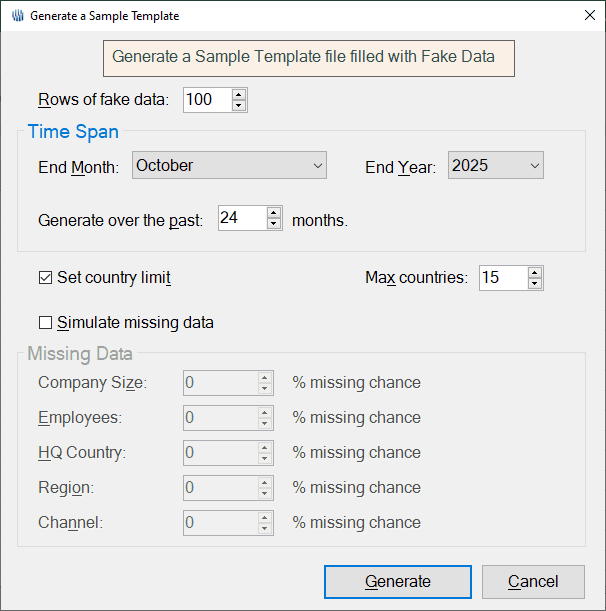
When generating a sample template, a dialog will appear with the following options:
- Number of rows of fake data
- Number of months of ARR data per row
- Maximum number of HQ countries to include (useful to avoid performance issues from too many country-based segments)
- Option to simulate missing data: you can choose a percentage of missing values in columns like Company Size, Employees, HQ Country, Region, Channel.
You can use this sample file as a guide by replacing the fake data with your real data.
3. Primary Analysis

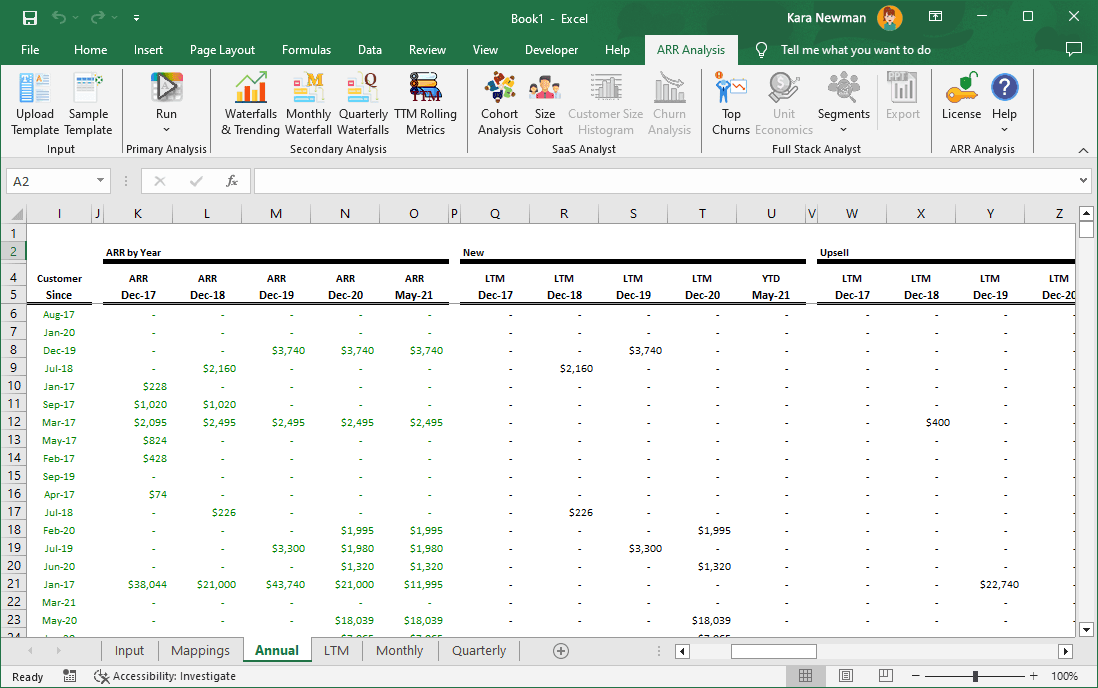
- Run – Generates sheets with four standard overviews:
- Annual
- LTM (Last Twelve Months)
- Monthly
- Quarterly
- Use the dropdown on the Run button to run a single analysis (e.g., just Quarterly) instead of all four.

These analyses calculate new ARR, upsell, downsell, and churn. They also generate customer rankings and cohort analyses.
4. Secondary Analysis
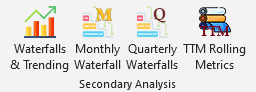
- Waterfalls & Trending– Generates waterfall analyses:
- ARR over time (annual)
- Logo waterfall
- Gross and net retention
- New bookings and churn

- You can also create rolling analyses for Monthly, Quarterly, and Trailing Twelve Months (TTM), including:
- Net and gross dollar retention
- Net new bookings
- ARR growth
- Logo growth and churn
- CAGR metrics

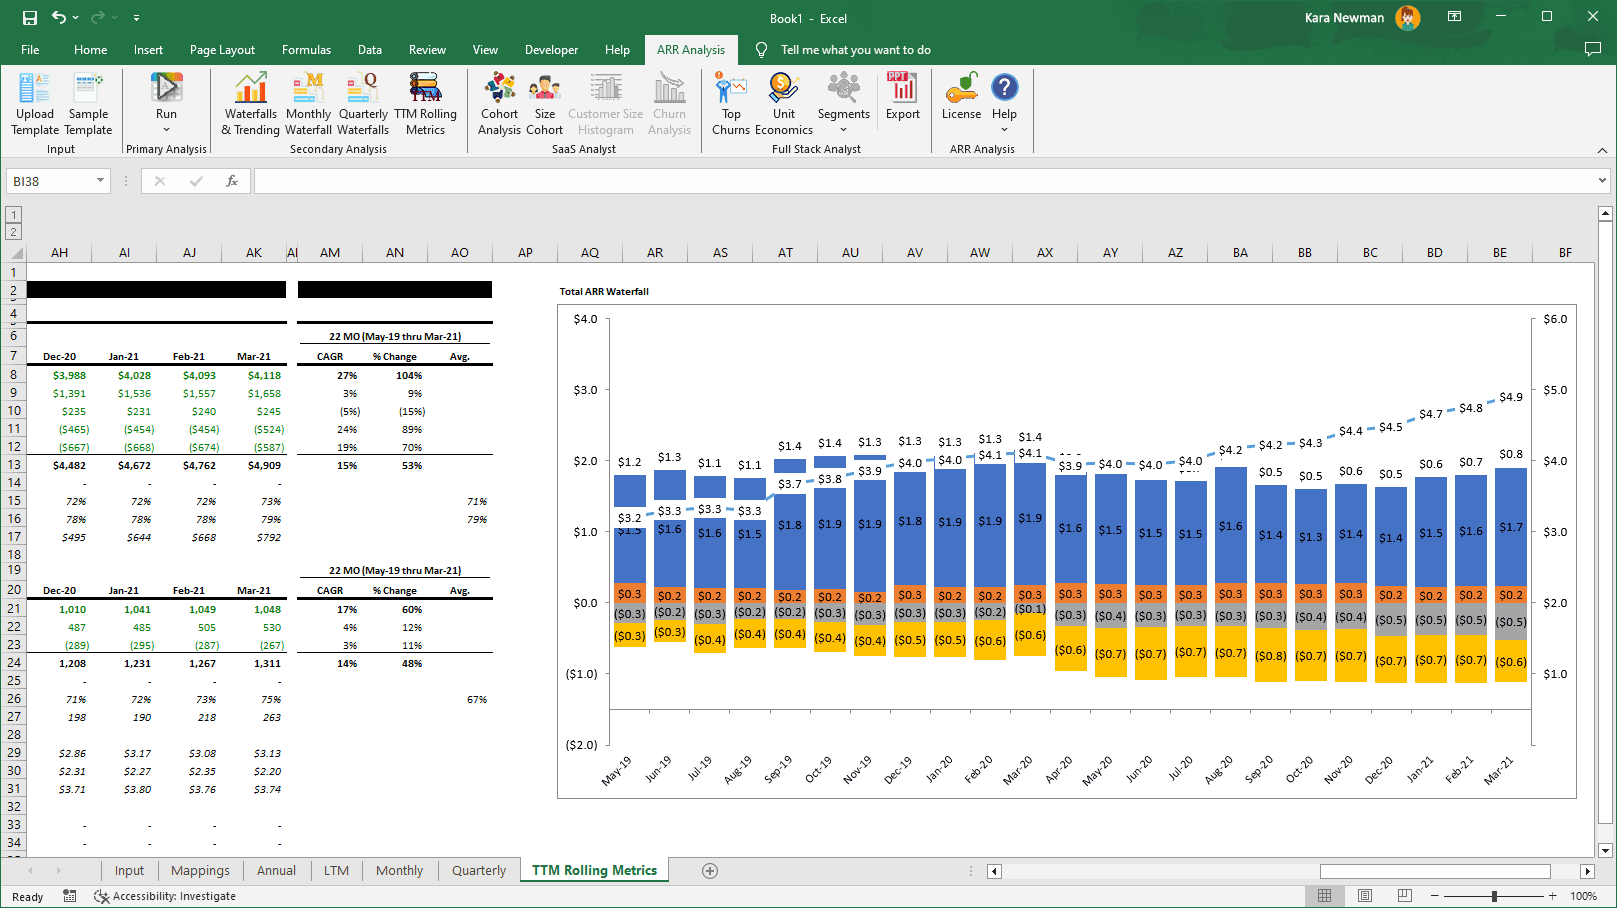
The TTM Metrics sheet also includes automatically generated charts for quick visualization.
5. SaaS Analyst
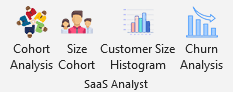
This tier enables deeper analysis of customer size distributions, churn, and retention.
- Cohort Analysis – Generates quarterly cohort performance and retention metrics.

- Size Cohort – Shows customer size distribution and ARR contribution, with table + chart outputs.

- Customer Size Histogram – Displays ARR distribution as a histogram.

- Churn Analysis – Analyzes churn by tenure (months before churn). Includes tables and charts showing average retention over time.
 The add-in will also generate a table and graph to show churn by tenure on average for individual months, allowing the analyst to assess how a company retains over time, on average.
6. Full Stack Analyst
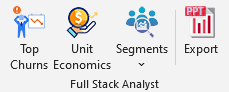
- Top Churns – Lists the largest churned customers, including:
- Customer name
- ARR size
- Churn amount
- Customer tenure

- Unit Economics – Calculates:
- Lifetime Value (LTV)
- Customer lifetime
- LTV/CAC ratio(Requires rolling annual Sales & Marketing spend and monthly gross margin inputs)

- Segments – Runs ARR analysis by segments (e.g., industry, region, product).

Generates:
- Segment-specific waterfalls and trending
- ARR and logo counts by segment
- Rolling (Quarterly/TTM) waterfalls per segment
- Customer size distributions by segment

- Export– Exports generated analyses into a ready-to-use PowerPoint presentation.
7. ARR Analysis Group
- License – Activate or manage your license.
- Help Center – Open the online documentation.
- About – View version information about the add-in.
Cautionary Notes
- Make sure the uploaded template contains accurate and up-to-date data.
- Some features are only available depending on your subscription tier.
Tips for Efficiency
- Familiarize yourself with the ribbon layout to quickly find the tools you need.
- Use Excel keyboard shortcuts to work faster.
- Save your work regularly to avoid data loss.